PART II
Results
Fluorescence and Chlorophyll (SPAD) Measurements
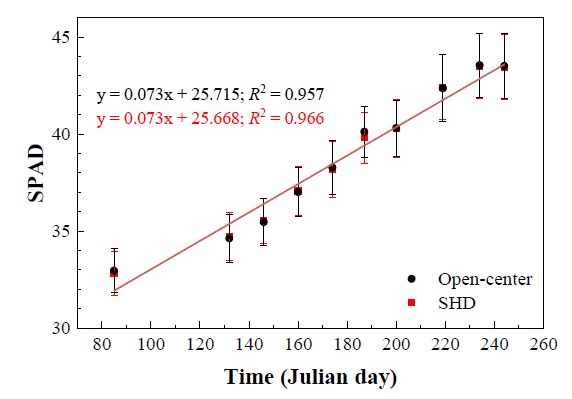
Fluorescence analysis (i.e., measurement of variable fluorescence (Fv) and estimation of the maximum quantum effciency of PSII photochemistry (Fv/Fm)) did not yield significant differences between the SHD and the open-center trees. The results of the SPAD measurements were also similar for open-center and hedgerow trees throughout the study period, in both years (Figure 1 shows SPAD data for 2018 growing season).
No significant differences were detected between SPAD values in the 2018 and 2019 growing seasons either.
Photosynthetically Active Radiation
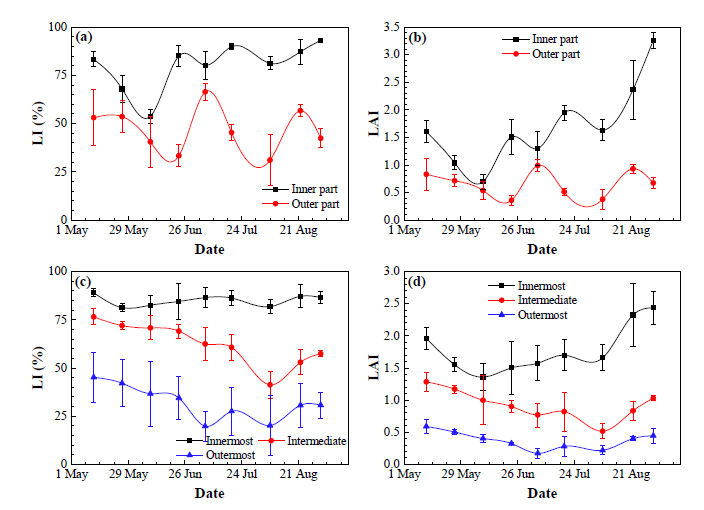
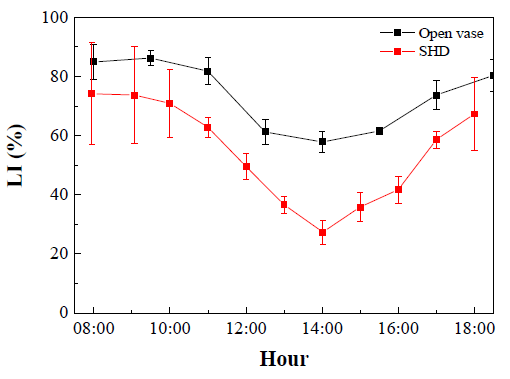
In both growing seasons, in the SHD system, noticeable differences were observed between the outer part and the inner part of the hedgerow (Figure 2 a,b), both in terms of percentage of light interception (LI) and leaf area index (LAI). In the open-center trees (Figure 2 c,d), differences in LI and LAI were observed as a function of the region under the canopy (innermost, intermediate and outermost). Oscillations should be mainly ascribed to the variability of incident sunlight, affected by partly cloudy days [33,34], which would be more evident in the SHD system because its smaller canopy does not cover the full space assigned.
The impact of mechanical pruning conducted in SHD twwice a year (at the end of May and October) to keep the canopy volume controlled should not have a major influence on LI or LAI variation, due to the mid-low vigor of the SHD trees.
The results from tempo-spatial LI measurements conducted in both systems on three dates in the 2019 growing season are shown in Figure 3. PAR measurements, which may be useful for estimating the photosynthetic radiation use effciency [35] or yield [35], are also shown in Figures S4 and S5.
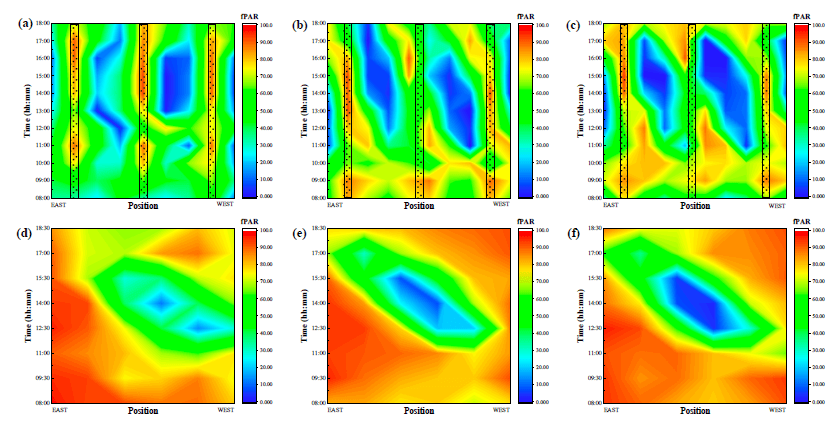
Taking into consideration the full data set of PAR recorded in 2019, we calculated the mean data for each point measured between two adjacent inter-rows in three parallel and consecutive determination lines, for each solar time (from 08:00 to 18:30), and across the three dates (24 June, 25 July and 31 August 2019). Results obtained are represented in Figure 4.
The effect of training system was very clear: the open-center resulted in higher PAR interception at all times and on the three dates than the SHD. This is due to its larger and three-dimensional canopy compared with the vertical and bidimensional canopy wall of the hedgerow-based system. Average percentages of light interception, considering all hours and dates, were 73.5% and 54.4% for open-center and SHD, respectively.
Productive Parameters
A summary of number of flowers, number of fruits, fruit set, productive parameters, yield effciency and fruit quality obtained in this study is presented in Table 2.
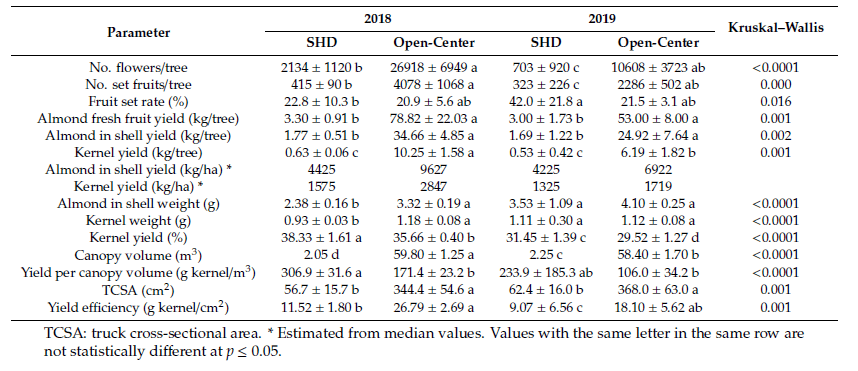
The training system clearly affected the agronomical performance of ‘Soleta’ cultivar, as reported in Table 2, mainly because large differences were recorded in tree volume canopy, as a consequence of differences in the TCSA between the two systems (if TCSA values in 2019 were interpreted as a vigor index, that of SHD trees with Rootpac-20 rootstock was only 17% of that of open-center trees with GF-677). Thus, the number of flowers and fruits were statistically different in both years, but not the fruit set rates. Similarly, kernel yield per ha was higher in the open-center system in both years because of the significant differences in canopy volume, resulting in more light interception (although it should be taken into consideration that, as discussed below, the spacing used in this first experimental SHD plot differs from the one currently used in commercial SHD orchards). Kernel weight was only affected by the training system in 2018. Kernel yield (%) showed better values in SHD compared to open-vase.
The results from PCA are summarized in Figure 5 and Figure S6 (correlation circles). The first, second and third component explained 55.23%, 28.35% and 7.75% of the variance, respectively (i.e., the cumulative explained variance was 91.34%). The parameters included in each component are indicated in Figure 5 (left). The strongest underlying trend in the feature set (component 1) was the “production” and that the second strongest underlying trend (component 2) was the “fruit” (weight for both almond in shell and kernel, and kernel yield). The third strongest underlying trend (component 3), uncorrelated with both components 1 and 2, was the fruit setting rate (Figure 5), which would depend on a “cultivar x year interaction” (alternate bearing, climatic conditions, etc.). An unexpected result from the PCA analysis was that canopy volume and yield per canopy volume parameters were enclosed in different component sets.
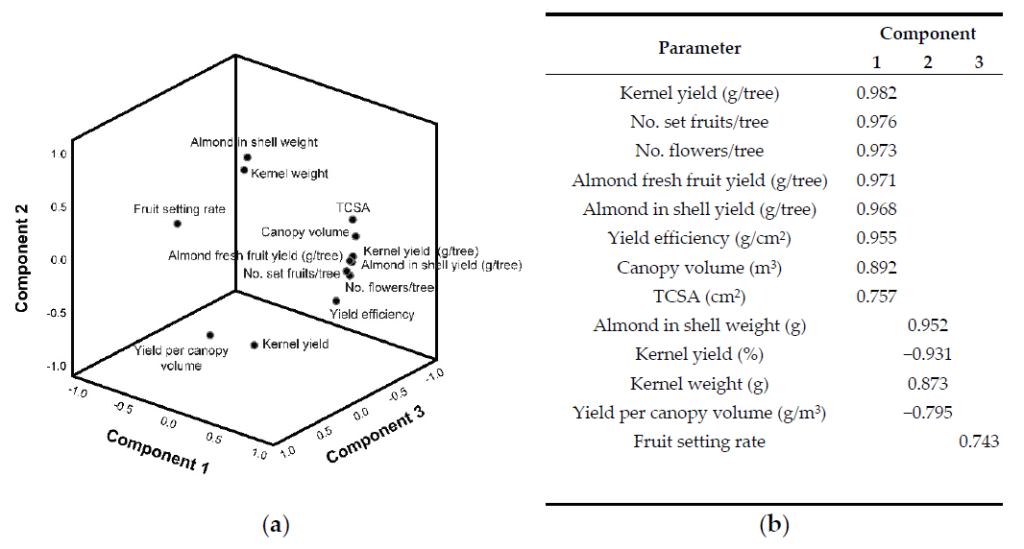
In any case, PCA successfully found linear combinations of the different markers, which separated out different clusters (Figure 6) corresponding to different training systems (open-center and SHD) and growing seasons (2018 and 2019).
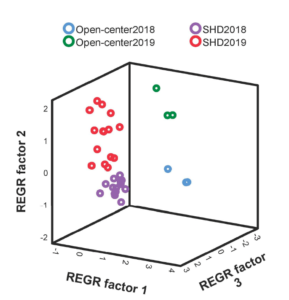
growing seasons (2018 and 2019).


